How can data visualization provide better decision making?
Tableau
Tableau is an analytics platform enabling users to explore and manipulate data.
In the era of big data, the ability to effectively communicate insights derived from complex datasets is crucial for businesses seeking to make informed decisions. Data visualization, the graphical representation of information and data, plays a pivotal role in translating raw data into actionable insights. Among the tools available for data visualization, Tableau stands out as a leader, enabling users to not only visualize data but also to craft engaging narratives that resonate with audiences.
The Essence of Data Visualization
Data visualization goes beyond simply presenting data in a visually appealing format. It serves as a bridge between the data and the human, allowing complex information to be understood at a glance. By transforming numbers and statistics into charts, graphs, and interactive dashboards, data visualization enables stakeholders to uncover patterns, trends, and outliers that might otherwise remain hidden within the data.
The Storytelling Element
One of the key strengths of data visualization, particularly with tools like Tableau, is its capacity to tell a compelling story with data. Rather than overwhelming audiences with rows of numbers or tables of figures, data visualization allows for the creation of narratives that guide viewers through the data, helping them grasp the significance of the insights being presented.
Through an intuitive interface, Tableau empowers users to craft visual stories that not only informs but also persuades. From stories to intricate dashboards, Tableau offers a diverse array of visualization options that can be tailored to suit the specific needs and preferences of each audience.
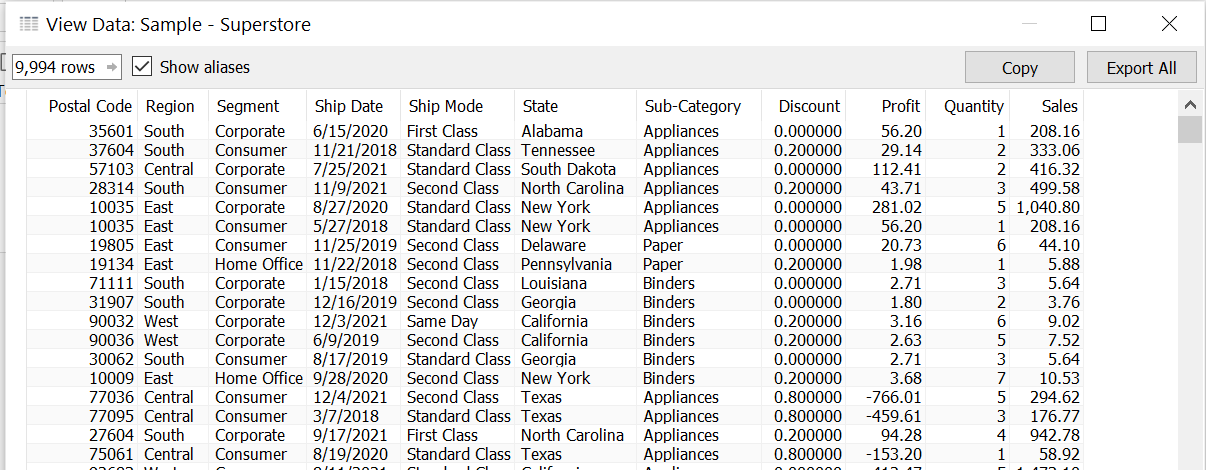
Transform Tabular Data
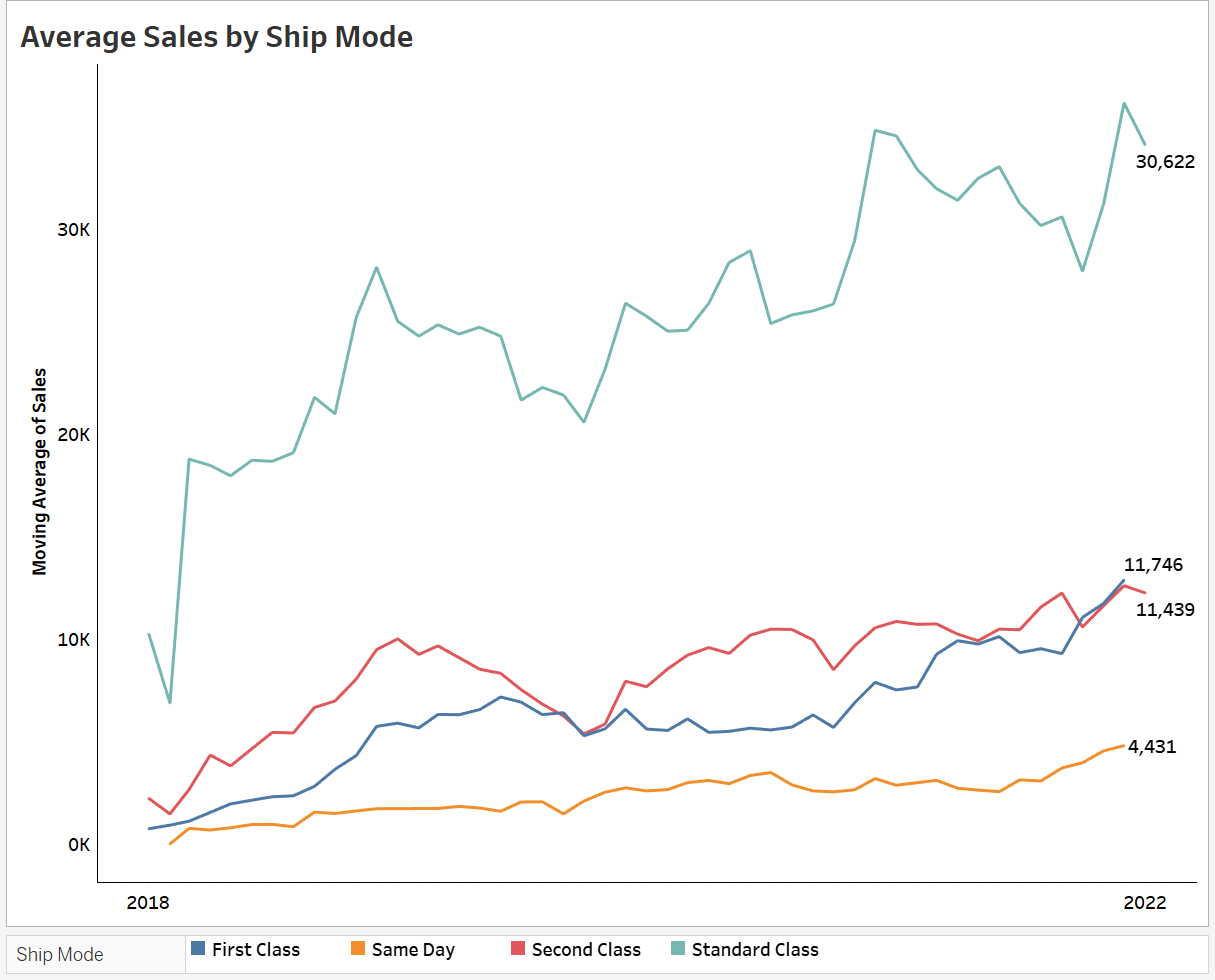
Into Visual Data
The Impact on Decision-Making
Effective data visualization can have a profound impact on decision-making within organizations. By presenting data in a clear and engaging manner, decision-makers are better equipped to understand the implications of the data and make informed choices.
Conclusion
In conclusion, data visualization, when harnessed effectively with tools like Tableau, has the power to transform data into stories that inform, inspire, and drive meaningful change. By leveraging the visual medium to communicate insights in a compelling and accessible manner, organizations can unlock the full potential of their data and chart a course towards success in an increasingly data-driven world.
Through the art of storytelling with data, businesses can not only enhance their decision-making processes but also foster a culture of data-driven innovation that propels them ahead of the competition. With Tableau as a trusted ally in the realm of data visualization, the possibilities for uncovering valuable insights and driving growth are limitless.


